JCself is developed for the production of a MIDI file or an orchestra and score file for further processing with the program Csound.
In an iterative process JCself determines random and selection terms.
Selecting a value alters the possible selection of the following values. The more often a definite value is calculated the higher the system ranks its possible repetition.
These terms are assigned then to the attributes of tones.
The composer decides about the frame within which JCself then composes on its own.The possible attributes of tones and the Theory of probabilities are thus included.
While the program is working it decides itself about the distribution of certain values. By “organizing itself” synergetic structures are formed.
Calculated values are related to the frequencies (in Hz) of the appropriate tones. All the other features/elements of a tone, length, sound volume, stereo effect or neighboring tone/chord etc. are computed in relation to the highest value so far. The closer the current value lies to the most frequent value identified so far
- the shorter
- the louder
- the more precise it sounds ; stereo speakers assumed.
Furthermore the tone is surrounded by more voices and its counterpoint is more consistent (cf. counterpoint).
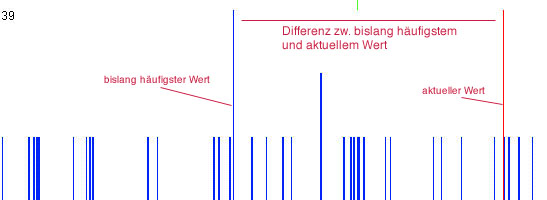
JCself calculates the difference between the most often found value, so far and the topical one and thus derives volume and duration.
As to panning (distribution to the loud speakers) the program considers whether the topical value weighs more to the left (is minor/smaller) or more to the right (is major/ larger) than the most frequent one, so far.

JCself offers a 2 or 3 dimensional chart whose values represent those of the frequency scale (minimum and maximum frequency). This frequency scale is previously determined by the composer (cf. below)
Frequency values or a part of the frequency values (in Hz) are shown in the columns of the chart.
A blue arrow shows the current value calculated by JCself.
The arrow leaves an input/entry at the according position (in the according column).
A green arrow indicates the seed frequency and a black one the highest topical value.
The most frequent value is depicted and reflected within the full height of the chart.
__________________________________________________________________
Additional features like melody cascades, loops and variation of tempo are triggered off by a further stochastic method (cf. machine under composition)

